
Measure Point
In scenes where the RTK signal is lost (underpasses, under overpasses, inside buildings), SLAM mapping combined with real-time RTK fusion provides the ability to obtain absolute coordinates while the RTK is unlocked. Within 50 m after the RTK is disconnected, the L2 Pro meets a horizontal and vertical accuracy of <= 5 cm; within 100 m, it meets a horizontal and vertical accuracy of <= 10 cm.
Prerequisites for the Use Case
- Firmware version 2.3.0 or above.
- RTK is connected.
- The RTK source ellipsoid is WGS84 or CGCS2000.
- After device initialization, with the RTK in the fixed-solution state, walk an L-shaped route of 10 m × 10 m.
- The route must have a good RTK signal and maintain a fixed solution, covering three sides of the entire survey area.
- The RTK disconnection must not exceed 100 m.
- It must comply with the device's capture specifications.
Real-World Examples
1. Capture example illustration:
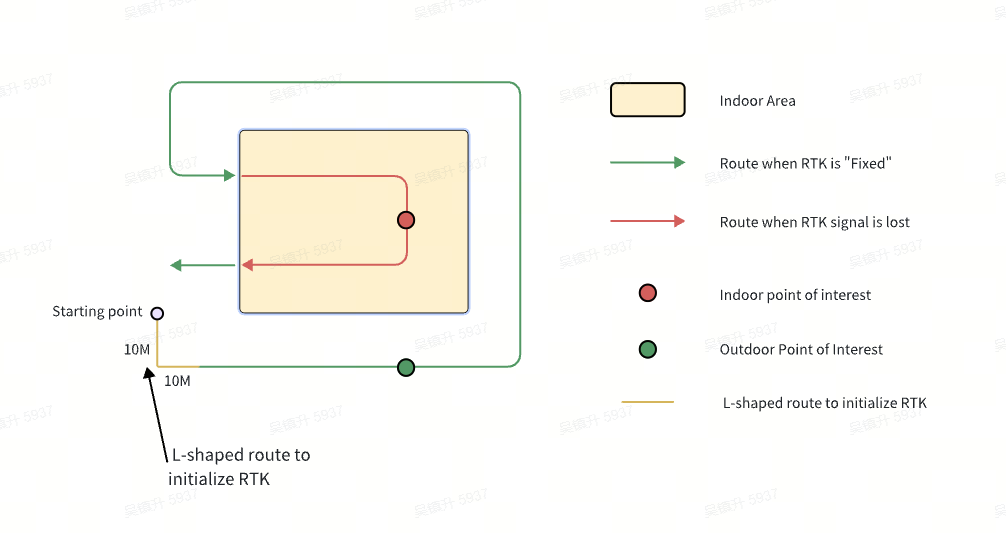
Green is the route with an RTK fixed solution, and red is the RTK-unlocked state. If the travel distance between the measurement point and the position where the RTK state changes is within 50 m, the absolute-coordinate accuracy of the measurement point can be kept within 5 cm. If the travel-path distance between the measurement point and the position where the RTK state changes is within 100 m, the absolute-coordinate accuracy of the measurement point can be kept within 10 cm.
2. Result files
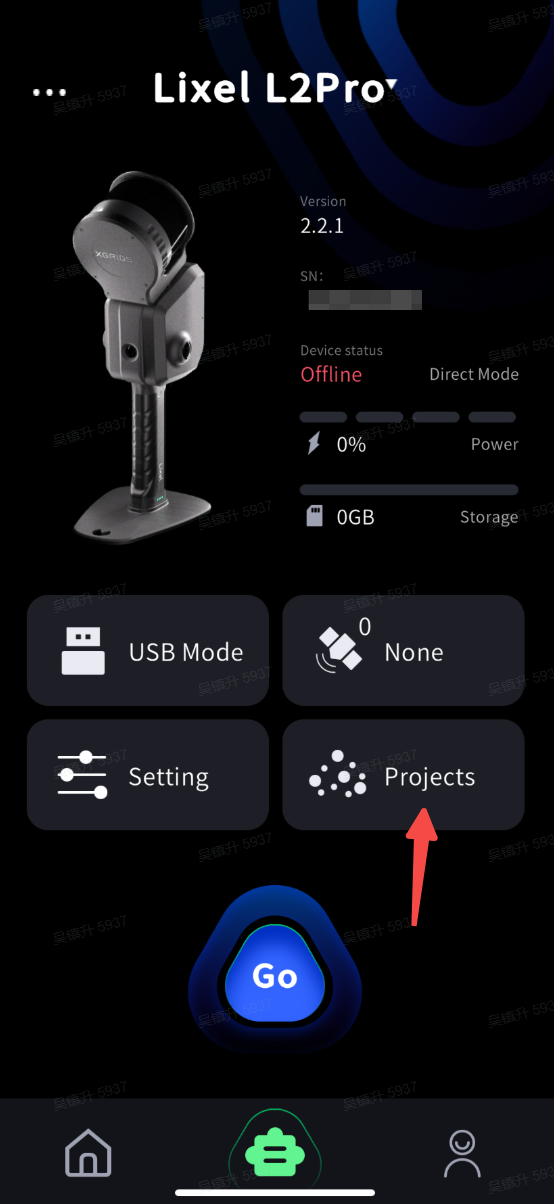
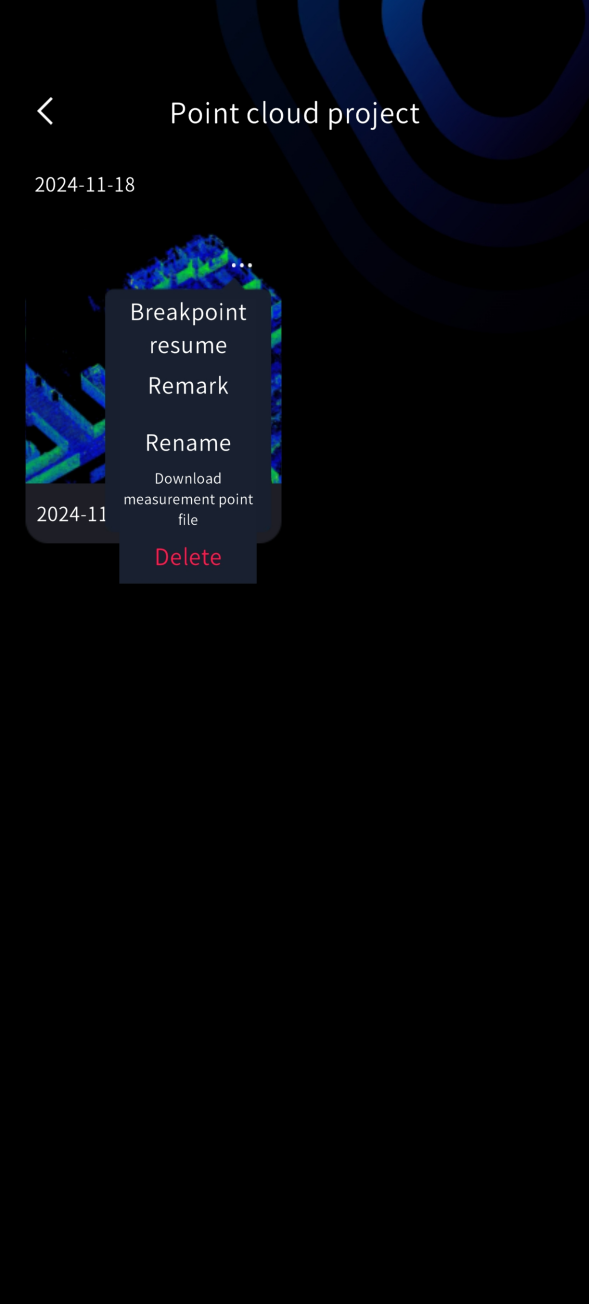
On the device page in LixelGO, enter the point cloud data to view historical projects. Tap " ... " in the top-right corner and tap "Download measurement point file" to download the measurement points measure_points_latest.csv to the app locally.
Illustration:
Under the project file project_data, two real-time RTK measurement results are saved: one is the real-time measurement result, and the other is the result after optimization once scanning is complete.
| File path | Description |
|---|---|
| /project_data/measure_points.csv | This file stores the real-time measurement result, consistent with what the app shows. |
| /project_data/measure_points_latest.csv | This file stores the measurement result after map-based optimization, which may differ slightly from what the app shows. The measurement point file downloaded from the point cloud project on the app is measure_points_latest.csv. |
measure_points.csv and measure_points_latest.csv have the same header; the difference is that measure_points_latest.csv is the optimized result after scanning is complete. Using the measure_points_latest.csv result is recommended. The meaning of the measure_points.csv header fields is shown in the table below:
| #timestamp | Timestamp |
|---|---|
| id | ID number |
| type | GNSS type: wgs84: 2, cgcs2000: 3 |
| label | Measurement point name |
| B | Latitude (°) |
| L | Longitude (°) |
| H | Geodetic height (m) |
| E | Easting (m) |
| N | Northing (m) |
| Z | Geodetic height (m) |
| undulation | Height anomaly (m) |
| std | Measurement point standard deviation (m) |
| x | Local coordinate x |
| y | Local coordinate y |
| z | Local coordinate z |